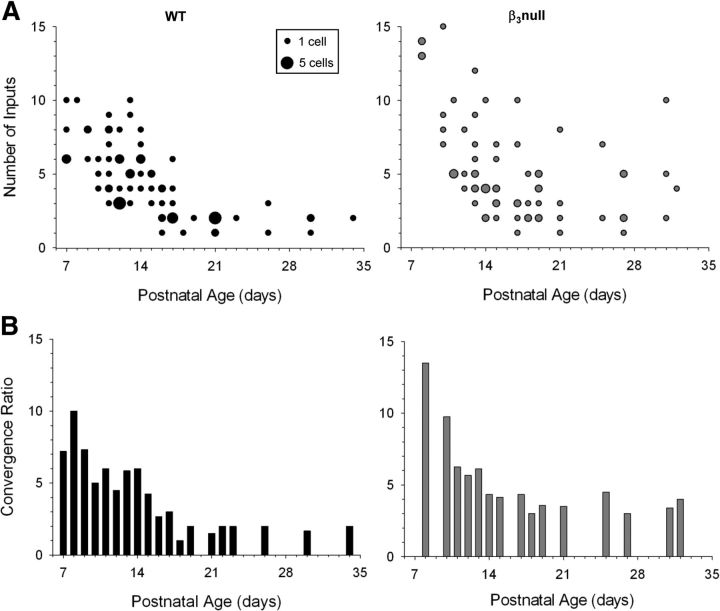
Figure 8.
Estimates of retinal convergence in WT and β3-null dLGN cells. A, Scatterplots showing the estimated number of inputs by age for WT (left) and β3-null (right) cells. The smallest dot represents a single cell, the largest dot represents five cells, and intermediate sized dots represent two to four cells. B, Histograms of convergence ratios by age for WT (left) and β3-null (right) cells. Each bar depicts the convergence ratio computed by dividing the total number of retinal inputs by the total number of cells recorded at that age. β3-null cells continued to retain higher levels of convergence at late postnatal ages. Convergence ratio distributions between WT and β3-null cells were significantly different (Kolmogorov–Smirnov, Z = 1.524, p < 0.02). β3-null (WT) cells: 68 (78).

