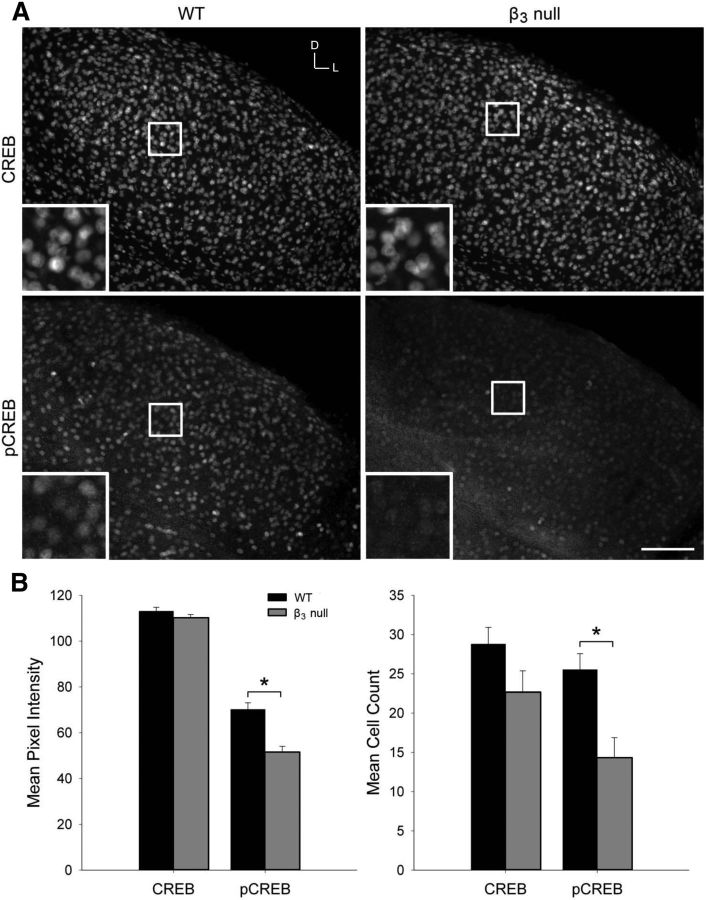
Figure 9.
CREB and pCREB labeling in WT and β3-null dLGN cells. A, Fluorescent immunostaining for total CREB (top) and pCREB (bottom) in 40-μm-thick coronal sections of P10 WT (left) and β3-null (right) dLGN cells. Boxes indicate the location of the magnified view, seen in the inset in each image. Scale bar: low magnification, 100 μm; high magnification, 40 μm. D, Dorsal; L, lateral. B, Plots show the mean and SEM of CREB and pCREB pixel intensity of fluorescence (left) and mean cell count (right) in three to four 100 μm × 100 μm sections of each dLGN in WT (black) and β3-null (gray) mice. *p < 0.05, comparisons between genotypes. β3-null (WT) dLGN: CREB, 12 (11); pCREB, 10 (10) from 6 mice.

