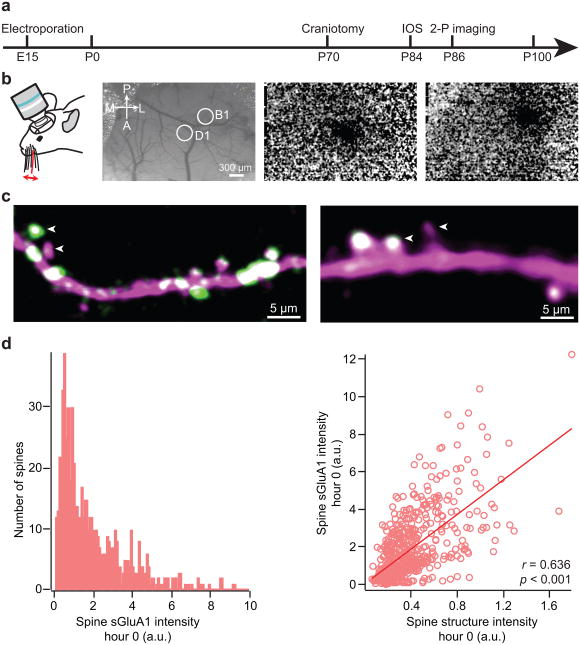
Figure 1. Expression of SEP-GluA1 in layer 2/3 barrel cortex neurons in vivo.
a, Time line of experimental design. IOS = intrinsic optical signal imaging. b, Intrinsic optical signal imaging. Cortical surface blood vessels can be imaged with green light (left). 10 Hz deflection of the D1 (center) or B1 (right) whisker evokes a localized change in reflected red light resulting from the coupling of blood flow to neural activity. c. Representative images showing expression of dsRed2 (magenta) and SEP-GluA1 (green). Note the different SEP-GluA1 level in neighboring spines (arrowheads). d, Histogram of spine sGluA1 intensity before whisker stimulation at hour 0 (left). Correlation between spine sGluA1 and spine size before whisker stimulation at hour 0 (right). r, Pearson's linear correlation coefficient, p value is from Monte-Carlo shuffling.

