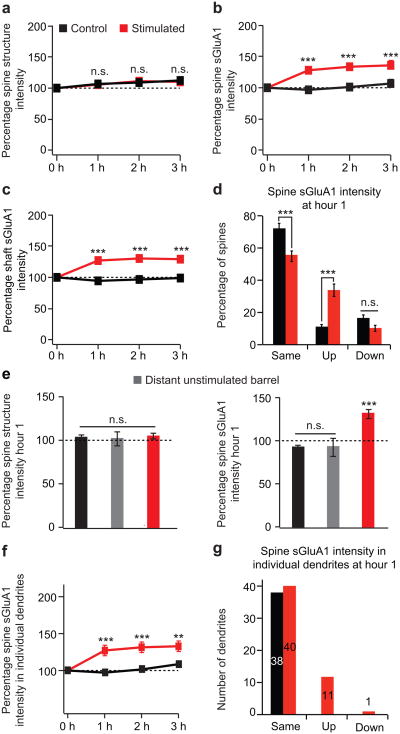
Figure 3. Acute whisker stimulation leads to an increase in spine sGluA1 and shaft sGluA1, but has little effect on spine size.
a, Spine structure intensity (dsRed2 signal) at hour 0, 1, 2, and 3 in control and stimulated animals. b, Spine sGluA1 intensity (SEP-GluA1 signal) in control and stimulated animals. c, Shaft sGluA1 intensity in control and stimulated animals. d, Categorization of spine sGluA1 responses at hour 1, same (> 70% and < 130%), up (≥ 130%), and down (≤ 70%). e, Changes in spine structure intensity (left) and in spine sGluA1 intensity (right) at hour 1 in distant unstimulated barrels. f, Average sGluA1 intensity in spines belonging to the same dendrites in control and stimulated animals. g, Categorization of dendritic responses at hour 1 into the same, up, and down categories (same criterion as panel d). 585 spines, 52 dendrites in 6 stimulated animals; 493 spines, 38 dendrites in 5 control animals. 40 spines, 6 dendrites in 2 animals (distant unstimulated barrel in e). ***p < 0.001, **p < 0.01, two-way analysis of variance (ANOVA) with Bonferroni posttests. Error bars = s.e.m.

