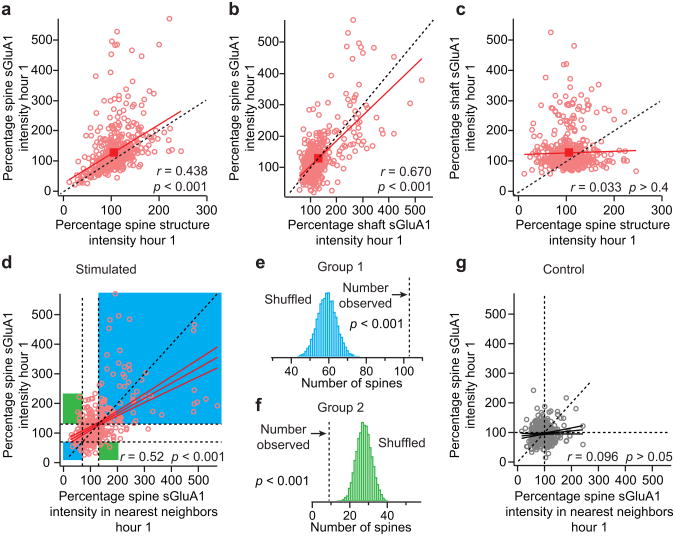
Figure 4. Changes in spine sGluA1 are positively correlated with shaft sGluA1 and spine size following whisker stimulation and neighboring spines cooperatively increase their spine sGluA1.
a, Correlation between spine sGluA1 and spine structure intensity at hour 1 in stimulated animals. b, Correlation between spine sGluA1 and shaft sGluA1 at hour 1 in stimulated animals. c, Correlation between shaft sGluA1 and spine structure intensity at hour 1 in stimulated animals. d, Changes in spine sGluA1 in neighboring spines at hour 1 in stimulated animals with linear fits (r = 0.5206, p < 0.001). Spine sGluA1 change in the same direction in neighboring spines were highlighted in light blue (x > 130% and y > 130%, x < 70% and y < 70%, Group 1), spine sGluA1 change in the opposite direction in neighboring spines were highlighted in green (x > 130% and y < 70%, x < 70% and y > 130%, Group 2). Dotted vertical line, left = 70%, right = 130%. Dotted horizontal line, upper = 130%, lower = 70%. e, Histogram of 10,000 random shuffles of the number of spines that change in the same direction with their neighboring spines in spine sGluA1. Dotted vertical line, the observed number of spines (103, Group 1 in panel d). Monte-Carlo p value is calculated by summing the tail of the shuffled histogram (Methods). f, Histogram of 10,000 random shuffles of the number of spines that change in the opposite direction with their neighboring spines in spine sGluA1. Dotted vertical line, the observed number of spines (9, Group 2 in panel d). Monte-Carlo p value is calculated by summing the tail of the shuffled histogram (Methods). g, Changes in spine sGluA1 in neighboring spines at hour 1 in control animals with linear fits (r = 0.096, p = 0.06). r, Pearson's linear correlation coefficient. p, Pearson's correlation t test.

