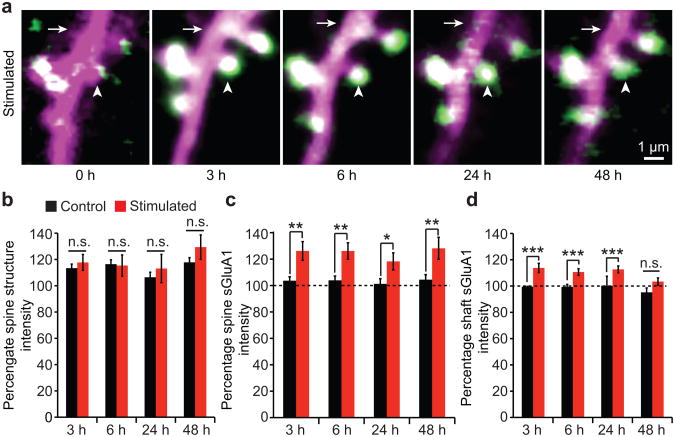
Figure 6. Increase in spine sGluA1 following whisker stimulation is stable for 48 hours, while increase in shaft sGluA1 declines over time.
a, Representative images of dendrites taken at hour 3, 6, 24, and 48 following acute whisker stimulation. Arrowheads mark spines and arrows mark dendritic shafts (SEP-GluA1 in green, dsRed2 in magenta, overlap in white). b, Spine structure intensity at hour 3, 6, 24, and 48 in control and stimulated animals. c, Spine sGluA1 intensity in control and stimulated animals. d, Shaft sGluA1 intensity in control and stimulated animals. 105 spines, 13 dendrites in 3 stimulated animals, 142 spines, and 16 dendrites in 3 control animals. ***p < 0.001, **p < 0.01, *p < 0.05, two-way ANOVA with Bonferroni posttests. Error bars = s.e.m.

