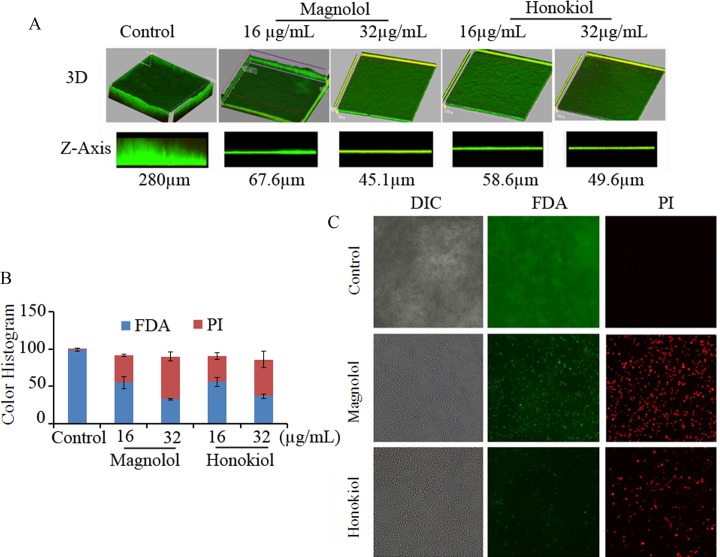
Fig 5. CLSM analysis showing the inhibition of biofilm development by honokiol and magnolol.
(A) The 3D images showing the biofilm in C. albicans SC5314 treated with drugs. The rotated 3D-view and the side view Z-axis were showed. (B) Red or green fluorescence intensity was calculated using histogram in ImageJ. Bars represent means ± S.E.M. (C) Fluorescent microscopic was used to visualize formation of biofilm stained with FDA and PI in C. albicans SC5314 treated with 16 μg/mL magnolol or honokiol.

