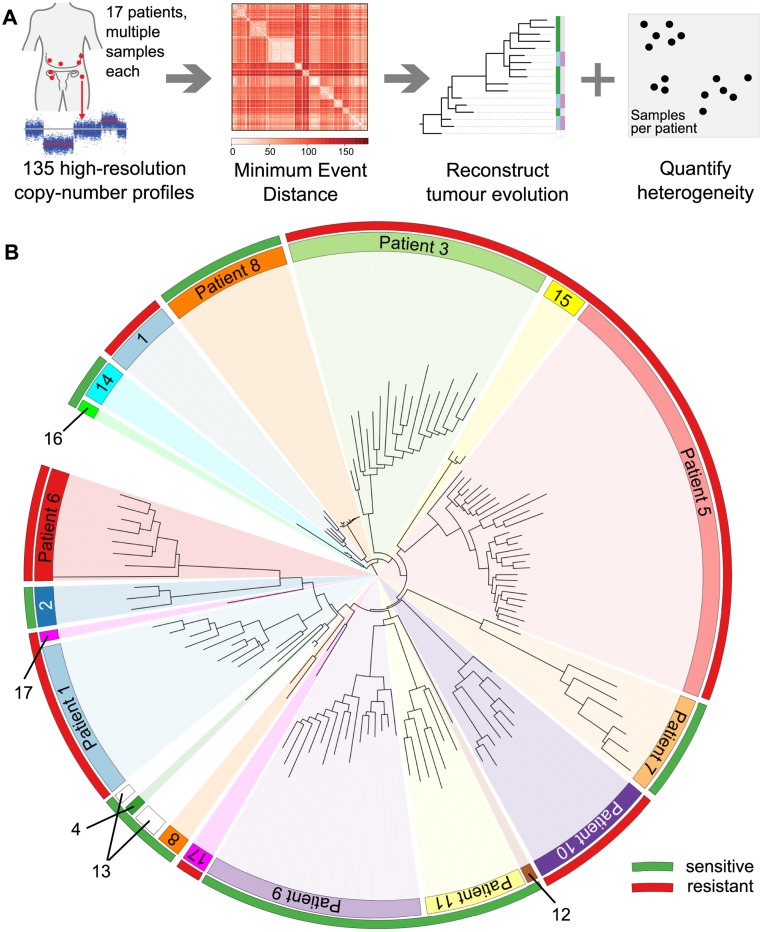
Fig 1. Overview of the analysis and the clinical dataset.
(A) Numerical quantification of intra-tumour genetic heterogeneity by evolutionary comparisons. Copy number profiles from 135 metastatic sites were obtained for 17 patients with HGSOC. The MEDICC algorithm was used to compute minimum event distances between profiles and to reconstruct the evolutionary history for each sample, enabling numerical quantification of both spatial and TH and CE for each patient. (B) HGSOC exhibits significant patient-specific intra-tumour genetic heterogeneity. Neighbour-joining tree of all samples based on total copy number. Samples from each patient (coloured inner circular bar) cluster into clades. The outer circular bar indicates HGSOC classified as resistant versus sensitive to treatment based on survival: red, resistant, PFS < 12 mo; green, sensitive, PFS > 12 mo. No immediate clustering of patients into sensitive and resistant subgroups is visible.

