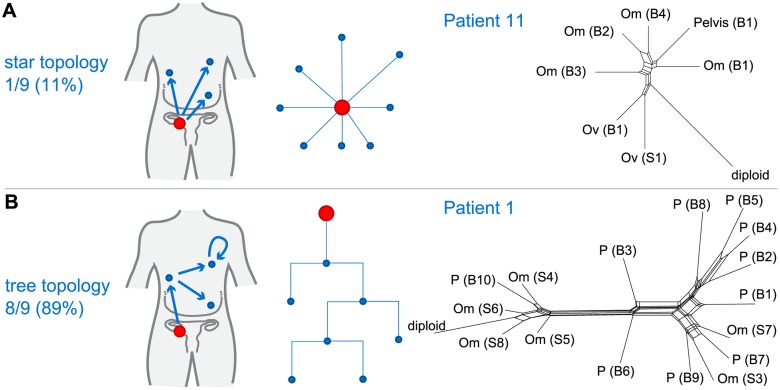
Fig 3. Branching patterns in HGSOC.
(A) Radial pattern of metastatic spread leads to a star topology. The schematic shows how the evolutionary relationships are predicted to have a star-like topology if all metastases (blue) are derived from the primary lesion (red). A neighbour-net representation of the evolutionary distances from patient 11 shows deviation from a tree structure (right). (B) Branched metastatic spread leads to a tree topology. The schematic shows that evolutionary history is predicted to be tree-like if metastases create new metastases (including metastasis-to-metastasis spread). A neighbour-net representation of the distance matrix for patient 1 shows a tree-like structure (right). The number and proportion of patients classified to star or tree topology are shown. Labels on trees indicate site of metastasis (Om, omentum; Ov, ovary; P, peritoneum). Sample identifiers indicate whether the sample was collected from pre-chemotherapy biopsy (B) or interval debulking surgery (S).

