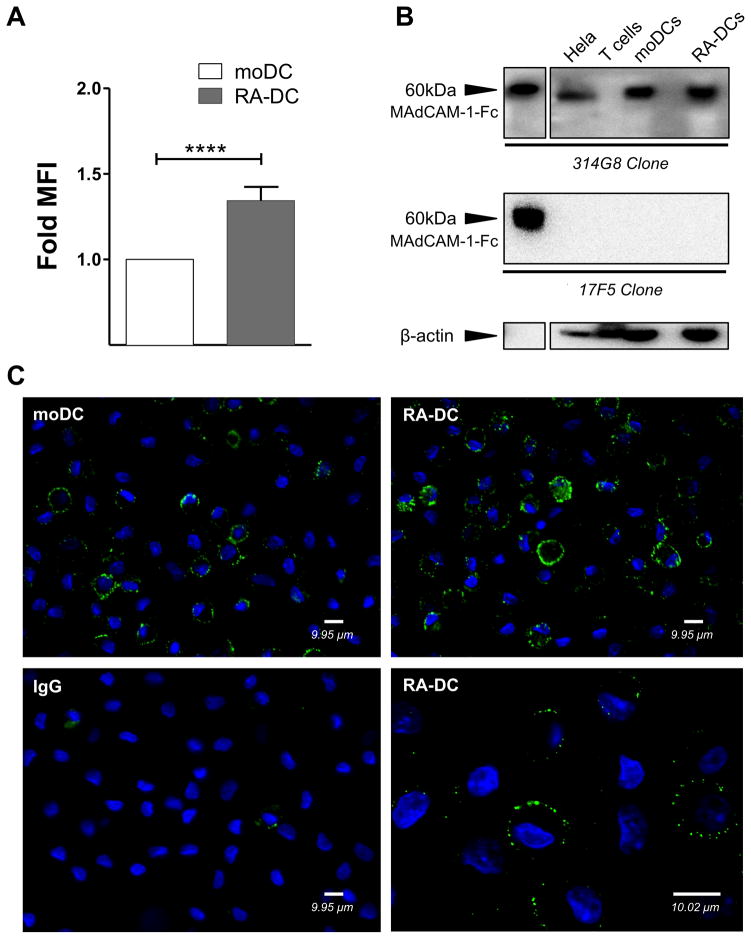
Figure 3. MAdCAM-1 is detected on moDCs and RA treatment increases its expression.
(A) moDCs and RA-DCs were gated on live, single, CD11c+ cells. The fold increase (mean ± SEM, n=39) of MAdCAM-1 MFI on RA-DCs is shown compared to the control moDCs (set as 1). p<0.05 is considered significant (****p<0.0001). (B) Representative blots of MAdCAM-1 detection in total lysates of moDCs, RA-DCs, CD4+ T cells (negative control) and HeLa cells (cell lysate positive control) with anti-MAdCAM-1 mAbs (clones 314G8 upper membrane and 17F5 middle membrane). Soluble MAdCAM-Fc (MAdCAM-1) was used as positive control. Anti-β-Actin mAb was used for normalization (lower membrane). RA-DCs expressed slightly more total MAdCAM-1, 1.18±0.06 fold (mean ± SEM, n=7), when comparing the fold intensity of normalized MAdCAM-1 content in RA-DCs compared to the control moDCs (set as 1). (C) moDCs (upper and lower left) and RA-DCs (upper and lower right) were immunostained for surface MAdCAM-1 (green) or the IgG control (lower left). DAPI-stained nuclei are in blue. Representative results of 1 out of 10 different donors are shown. Magnifications: 40x (upper row and lower left) and 100x (lower right). Scale bars correspond to 9.95μm (40x) and 10.02μm (100x).

