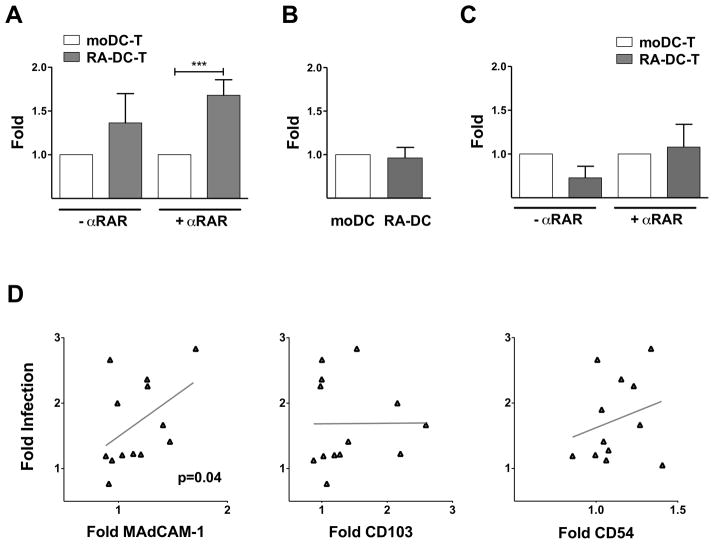
Figure 6. RA-DCs drive greater HIV replication than moDCs in DC-T cell cultures.
(A) The fold increase in HIV copies/cell (mean ± SEM, n= 7–10) for the RA-DC-T cell cultures are shown compared to the control moDC-T cell mixtures (set as 1) in the absence and presence of αRAR (***p<0.001). The fold increase in the MFI of the anti-p24 staining of HIV-pulsed DCs (B) and in HIV copies/cell of day 6-infected DC cultures (C) (mean ± SEM, n= 8) are shown for RA-DCs vs. moDCs (set as 1). (D) The fold increases in the MFI of MAdCAM-1, CD54 and CD103 on RA-DCs compared with moDCs (set as 1) are plotted against the fold increases in infection (HIV copies/cell) in the RA-DC-T cell mixtures (over moDC-T cell infections) with αRAR (each dot represents 1 donor run in triplicate; n=9–12). The linear regression fitting line and the spearman rank correlation p values are shown (*p<0.05 is considered significant).

