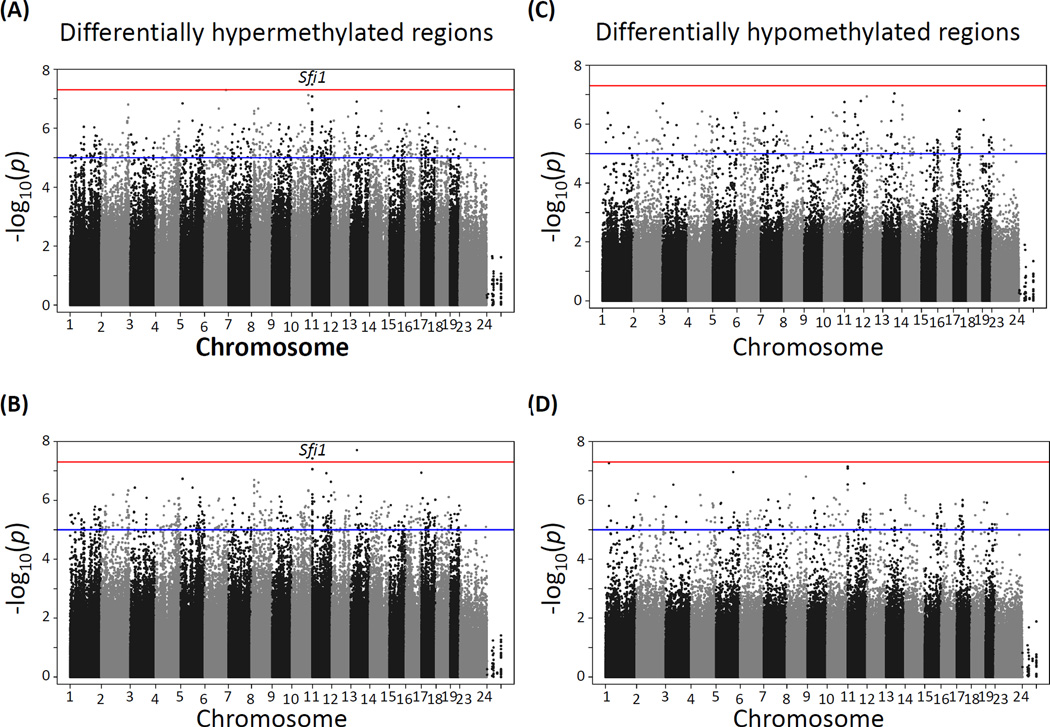
Figure 4. Manhattan plot of −log10 p-values of differential methylation across the mouse genome induced by lead acetate in the cortex of female mice.
(A) and (B): differentially hypermethylated regions in mice exposed to 3 ppm (A) and 30 ppm (B) of lead. (C) and (D): differentially hypomethylated regions in mice were exposed to 3 ppm (C) and 30 ppm (D) of lead.

