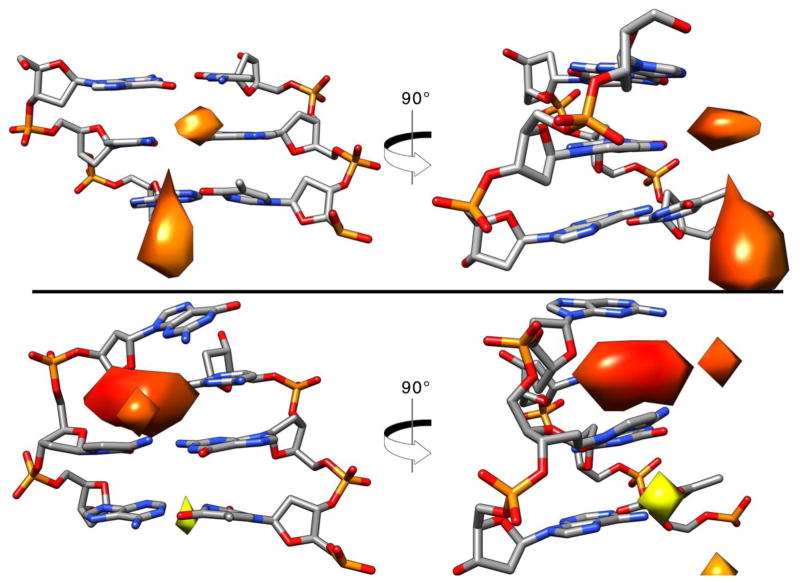
Figure 12.
Base opening events in relation to ion binding. Top: most populated structure from clustering analysis of Anton2 using average-linkage algorithm into 10 clusters. The 5x bulk K+ ion density is shown, only base-pair steps 1 through 3. Bottom: second most populated representative structure with an opening event and the K+ grid using the same ion density. Coloring of the grids are based on closeness to the center of the grid: red is closer, yellow is farther.

