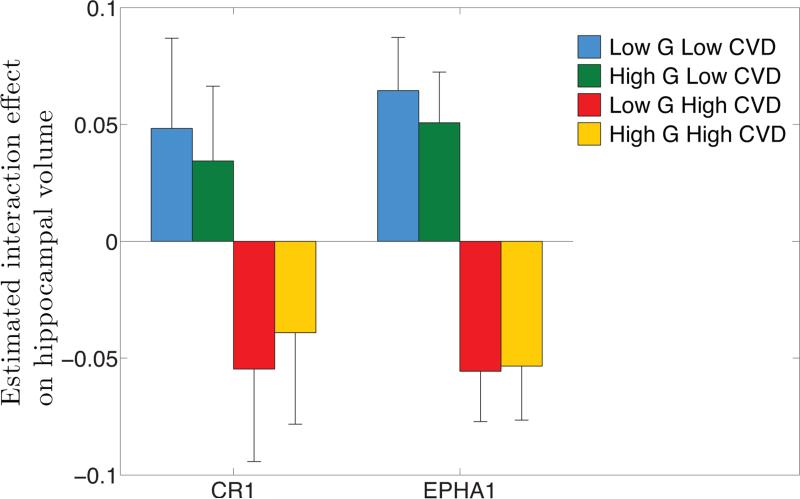
Figure 2.
Direction of significant interaction effects. For genes CR1 and EPHA1 that show significant interaction effect, genetic variables and cardiovascular disease (CVD) risk factors were collapsed into scalar variables; the RVT burden variable and the FHS risk score, respectively. The average of the estimated interaction effect ĥG×W within each of the four regimes (low genetic risk and low CVD risk, high genetic risk and low CVD risk, low genetic risk and high CVD risk, high genetic risk and high CVD risk) is shown with a standard error estimate obtained by Jackknife resampling. A smaller average indicates a higher risk of the interaction effect (smaller hippocampal volume).

