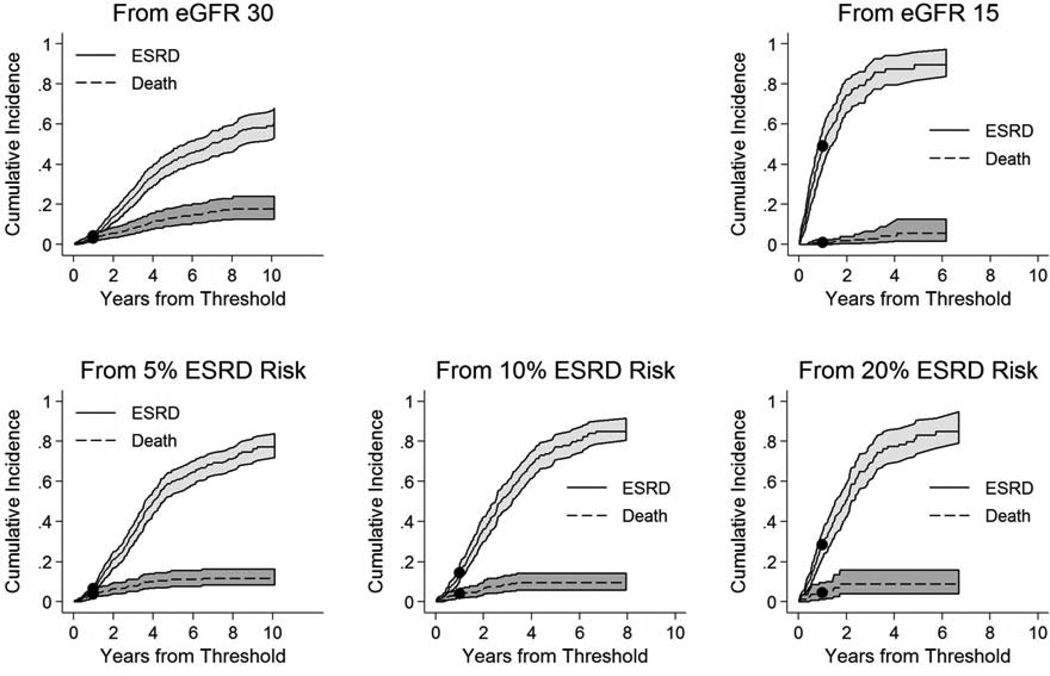
Figure 2.
Cumulative incidence of end-stage renal disease and death prior to end-stage renal disease from eGFR 30 ml/min/1.73 m2, eGFR 15 ml/min/1.73 m2, and 5%, 10%, and 20% 1-year risk of end-stage renal disease†
† Curves reflect cumulative incidence of ESRD and pre-ESRD mortality, where each outcome is treating as a competing event for the other. Confidence intervals were calculated by a boot-strap method using 10,000 repetitions. Models were adjusted to eGFR 30 and 15 ml/min/1.73 m2 in the eGFR threshold analyses and 5%, 10%, and 20% 1-year ESRD risk in the kidney failure risk threshold analyses. Solid circles represent incidence at 1 year.

