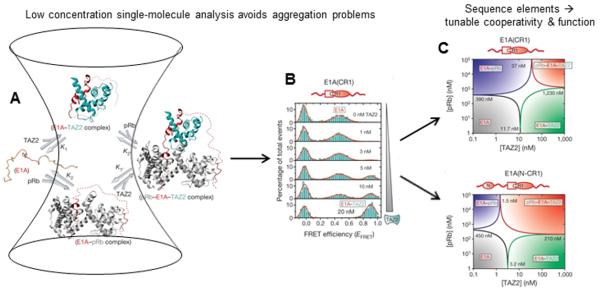
Figure 3. Allostery and regulation in IDPs.

Panel A depicts single-molecule detection of binding for the case of hub IDP E1A binding to two partners, with smFRET data shown in panel B. Panel C shows protein binding phase diagrams assembled from smFRET data, that demonstrate a switching of binding cooperativity depending on available E1A sequence elements. Panels A, B and C are adapted from Ferreon et al. Nature (2013) 498:390.
