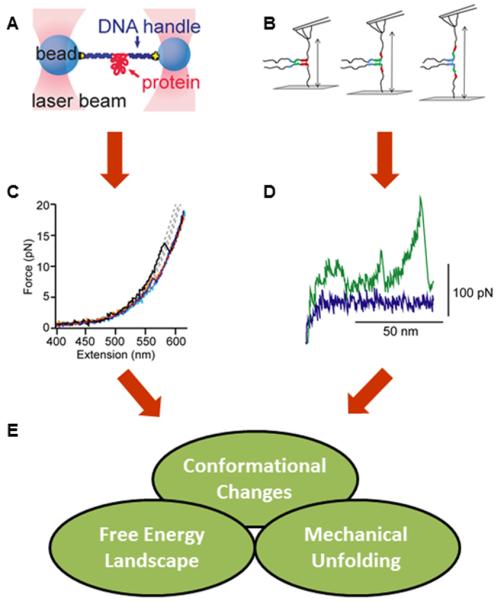
Figure 4. Mechanical measurements of IDPs.

Panels A and B show schematic experiments (A: optical tweezers B: AFM. Both techniques require attachment of the protein to the probes (beads for optical tweezers, surface and cantilever tip for AFM) through tethers. Panels C and D show typical sets of data obtained from these methods, presented as force-extension curves (FEC) (C: optical tweezers (adapted from 50) D: AFM (adapted from 52)). Optical tweezers FEC is showing extension of an aS monomer by force, where “sawtooth” like patterns depict mechanical conformational changes. The FEC in Panel D shows the same type of data acquired using AFM. Here, the middle peak was interpreted to report on a conformational change of aS monomer via mechanically “weak” interaction. Panel E shows the types information that can be obtained from these experiments. Panels A and C are adapted from Neupane and Solanki et al. PLoS ONE (2014) 9:e86495 [50]. Panel B is adapted from Krasnoslobodtsev et al. PLoS ONE (2012) 7:e38099 [51]. Panel D is adapted from Sandal and Valle et al. PLoS Biol (2008) 6:e6 [52].
