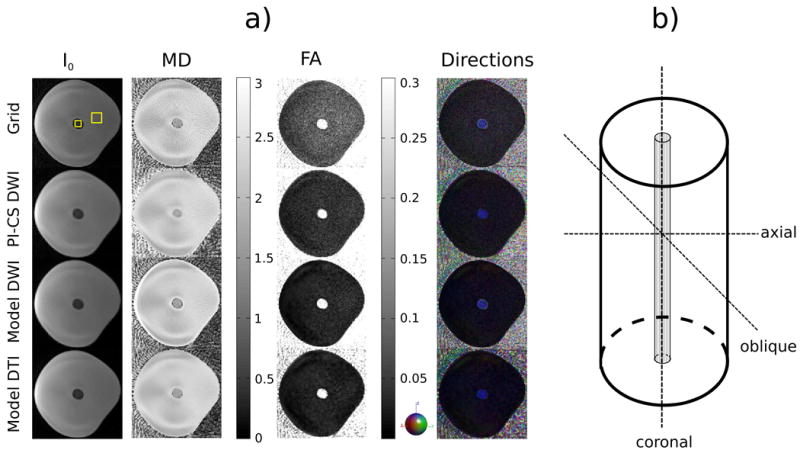
Figure 1.

a) Axial I0 image and maps of MD, FA and the color coded direction of the principal eigenvector of the phantom measurement with 61 spokes, two b-values and 6 diffusion-encoding directions for conventional gridding (Grid, first row), combined PI and CS on the diffusion-weighted images (PI-CS DWI, second row), model-based reconstruction with TV regularization of the diffusion-weighted images (Model DWI, third row) and model-based reconstruction with TV regularization of the tensor elements (Model DTI, fourth row). The ROIs used for the analysis in Table 1 are highlighted in the gridding reconstruction of the I0 image. b) Schematic of the phantom. The orientations where data was acquired are shown as dashed lines. The Dyneema fibers are located at the center of the phantom and are responsible for the anisotropy in the central region of the images in a.
