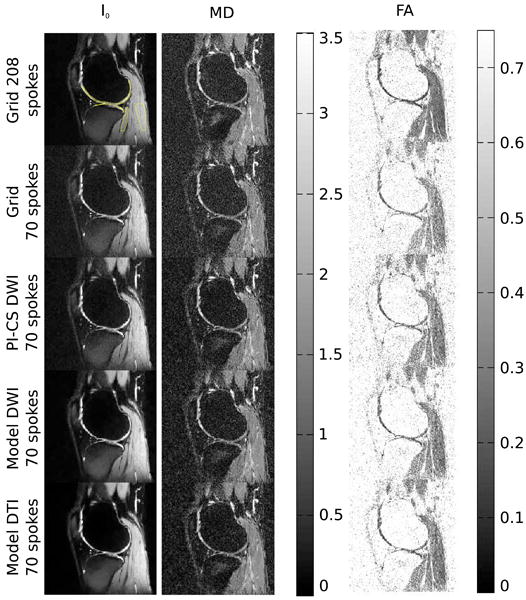
Figure 3.

I0 image and maps of MD and FA from measurements of the knee of a healthy volunteer with 208 and 70 spokes and two b-values for conventional gridding (Grid, first row 208 spokes, second row 70 spokes), combined PI and CS on the diffusion-weighted images (PI-CS DWI, third row), model-based reconstruction with TV of the diffusion-weighted images (Model DWI, fourth row) and model-based reconstruction with TV of the tensor elements (Model DTI, fifth row). The ROIs that were used for the evaluation of cartilage and muscle tissue in Table 2 are highlighted in the 208 spokes gridding reconstruction of the I0 image.
