
Figure 3.
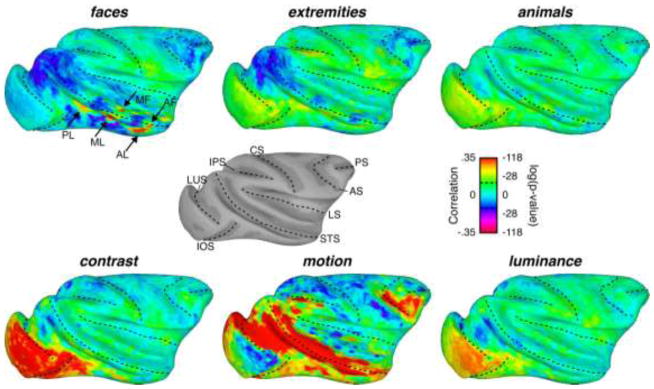
Inflated surface maps exhibiting the correlation between a given feature time course and the average brain activity in response to 15 movies. The dotted black lines on the surface maps represent the locations of the fundi of major sulci on the macaque brain. The gray-scale surface map depicts the surface anatomy from subject M2, who’s data is depicted here, with labels for the various sulci (LUS: lunate sulcus; iOS: inferior occipital sulcus; IPS: intraparietal sulcus; CS: central sulcus; STS: superior temporal sulcus; LS: lateral sulcus; AS: arcuate sulcus; PS: principal sulcus). Black arrows in the faces surface map show the approximate locations of the face patches (see Figure 2 legend for label names). Dotted lines in the scale bar represent a significant correlation at p=.05, Bonferroni corrected.