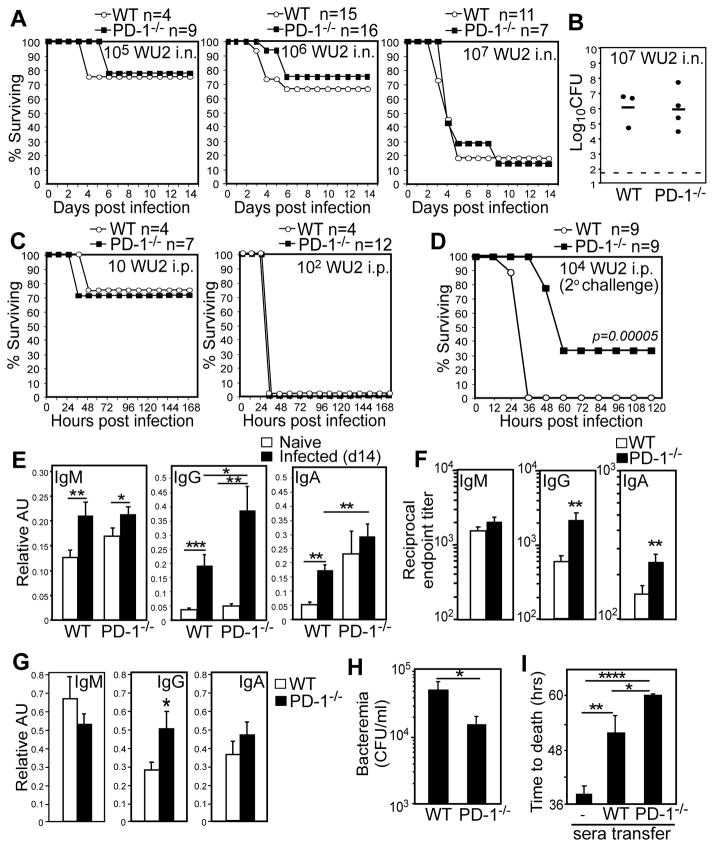
Figure 1. Naïve PD-1−/− mice generate increased capsule-specific IgG following S. pneumoniae respiratory infection and are protected against secondary lethal systemic infection.
Wild type (WT) or PD-1−/− mice were infected i.n. (A–B) or i.p. (C) with WU2 and monitored for signs of morbidity requiring euthanasia. A) Kaplan-Meier survival curves for naïve mice infected i.n. with 105, 106, or 107 CFU WU2. B) Lung bacterial burdens in WT and PD-1−/− mice 3 days post i.n. infection with 107 CFU WU2. C) Kaplan-Meier survival curves for naïve mice infected i.p. with 10 or 102 CFU WU2. D) Survival following secondary systemic pneumococcal infection. Three weeks following primary i.n. infection (106 CFU WU2), survivors were infected with 104 CFU WU2 i.p., with differences in survival curves assessed by Log-rank analysis (p=0.00005). The experiment was performed 3 times using 103 to 104 CFU WU2 (n=19 wild type mice and n=14 PD-1−/− mice), with differences in survival curves (Log-rank analysis, p= 0.002) similar to those shown in (D). E–F) Mean (±SEM) PPS3-specific serum IgM, IgG, and IgA levels (AU values in E and reciprocal endpoint titers in F) 14 days post i.n. infection with 106 CFU WU2 (n≥10 mice/group). Results representative of those obtained in 3 separate experiments. (G) Mean (±SEM) PPS3-specific IgM, IgG, and IgA levels in perfused lung homogenates 14 days post i.n. infection with 106 CFU WU2 (n≥11 mice/group). (H–I) Pooled sera from PD-1−/− (n=10) and WT (n=11) mice 14d post i.n. WU2 infection was administered to μMT mice i.p. concurrently with 200 CFU WU2 i.p. (H) Mean blood bacteria CFU/mL (±SEM) in recipient μMT mice 48 hr post infection. (I) Mean time to death in naïve and recipient μMT mice following i.p. infection (n=6–10 mice/group). Results representative of 2 independent experiments. In E–H, asterisks (*) indicate significant differences in values (p≤0.05, *; p≤0.01, **; p≤0.001, ***; p≤0.0001, ****; unpaired Student’s t test).

