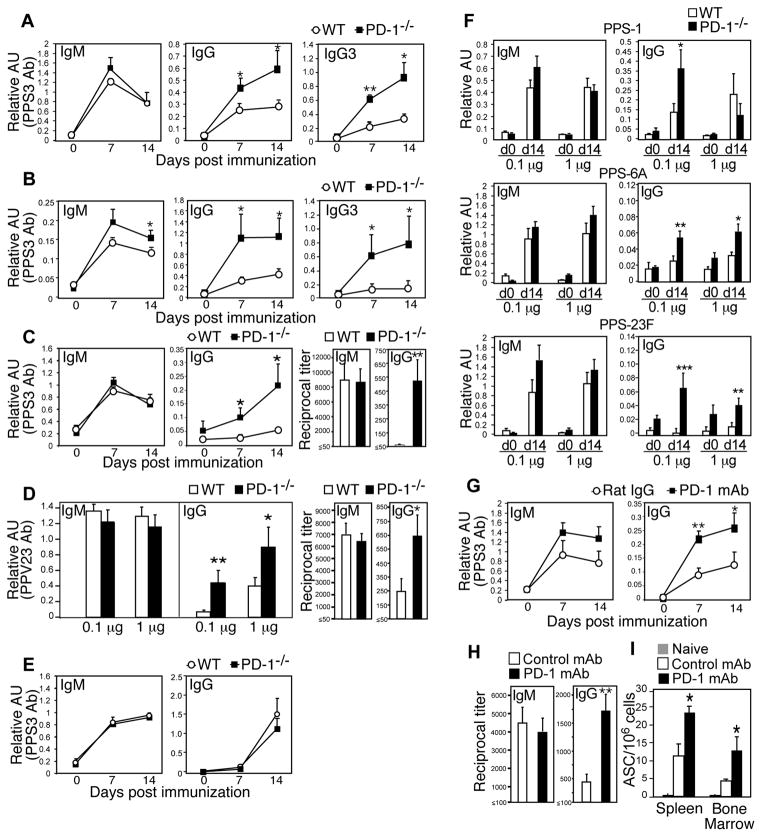
Figure 2. PD-1 suppresses IgG production against the native, but not protein-conjugated, PPS vaccine.
A–C) PPS3-specific serum IgM, IgG, and IgG3 levels in WT and PD-1−/− mice post immunization with: 0.1 μg purified PPS3 (A), an equivalent dose of 1 μg PPS3 contained in the PPV23 vaccine given i.p. (B) or s.c (C). D) PPV23-specific serum IgM (d7) and IgG (d14) levels after immunization with PPV23 containing 0.1 μg or 1 μg of each PPS. In C and D, d14 endpoint dilution titers are also shown. E) PPS3-specific serum IgM and IgG levels in WT and PD-1−/− mice following immunization with an equivalent dose of 0.1 μg PPS3 (CRM197-conjugated) contained within Prevnar-13. F) PPS-1, -6A, and -23F-specific serum IgM (d7) and IgG (d14) levels in WT and PD-1−/− mice following immunization with PPV23 containing 0.1 μg or 1 μg each PPS. G–I) PPS3-specific serum IgM and IgG levels on d0-14 (G), d14 endpoint dilution titers (H), and spleen and bone marrow PPS3-specific Ab-secreting cell frequencies (I; d40) in WT mice that received either PD-1 blocking mAb (RMP1-14) or control rat IgG mAb on d1, 3, and 5 post immunization with purified PPS3. In panels G and I, mice were immunized with 0.1 μg purified PPS3 and in panel H, with 1 μg purified PPS3. (A–I) Mean (±SEM) values are shown (n ≥ 4 mice/group). Asterisks (*) indicate significant differences in values (p≤0.05, *; p ≤ 0.01, **; p ≤ 0.001, ***; unpaired Student’s t test) between PD-1−/− and WT mice (A–F) or between WT mice receiving PD-1 versus control mAb (G–I).

