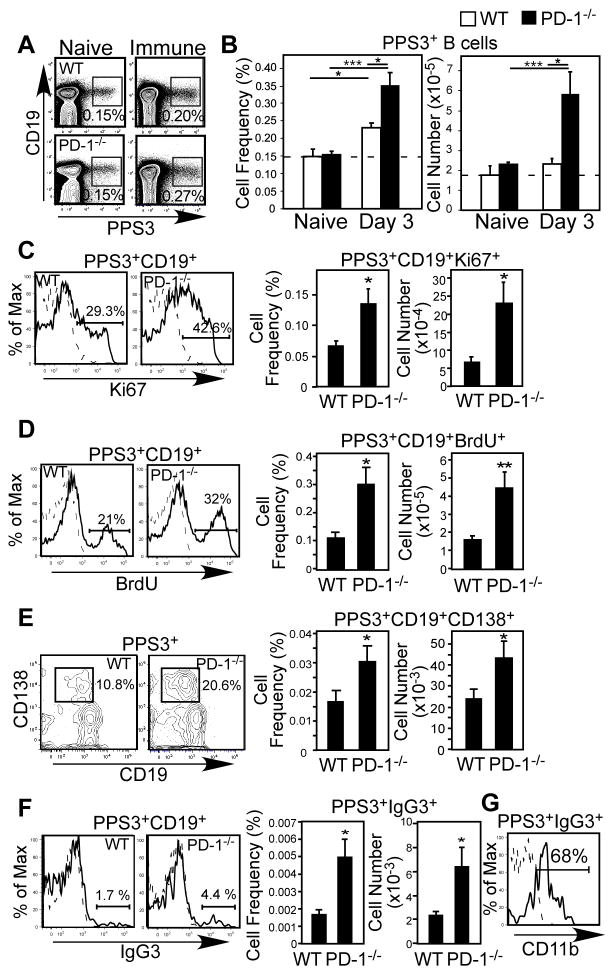
Figure 3. PD-1 is induced on activated PPS3-specific B cells and PD-1−/− mice have significantly increased PPS3-specific B cell proliferation, IgG switching, and ASC generation.
(A–G) Flow cytometric analysis and enumeration of PPS3-binding (Ag-specific) spleen cells from naïve and immune PD-1−/− and WT mice immunized with 0.1 μg purified PPS3. (A) Representative flow cytometric analysis of PPS3-specific splenic CD19+ B cells in naïve (left plots) and immune (d3; right plots) mice. Frequencies of gated cells are indicated. (B) Mean (±SEM) frequencies and cell numbers of splenic PPS3-specific splenic CD19+ B cells in naïve and d3 immune mice. (C) Representative intracellular Ki-67 expression by PPS3-specific splenic CD19+ B cells in d3 immune mice (solid line, left panel). Mean frequencies and numbers (±SEM) of PPS3-specific Ki-67+ cells splenic B cells are graphed. D) BrdU incorporation in PPS3-specific splenic CD19+ B cells 5 days post-immunization following a 5-day BrdU pulse (solid line, left panel). Mean frequencies and numbers (±SEM) of PPS3-specific BrdU+ splenic B cells are indicated. E) Representative PPS3-specific splenic CD19+CD138+ B cell staining in d5 immune mice (solid line, left panel). Mean frequencies and numbers (±SEM) of PPS3-specific CD138+ cells splenic B cells are graphed. F) Representative IgG3 staining of PPS3-specific splenic CD19+ B cells in immune mice (solid line, left panel). Graphs indicate total mean (±SEM) frequencies and cell numbers of PPS3-specific splenic IgG3+CD19+ B cells. (G) CD11b expression by PPS3-specific splenic IgG3+CD19+ B cells in immune PD-1−/− mice (solid line). In C, D, F, and G, the dashed histogram indicates mAb isotype control staining (intracellular staining in C and D or extracellular staining in F and G) for PPS3-specific B cells from immune mice. Asterisks (*) in B–F indicate significant differences between WT and PD-1−/− values (p ≤0.05, *; p ≤ 0.01, **; p ≤ 0.001, ***; n ≥ 3 mice/group). Student’s t test was used in B–E. In F, Welch’s t-test was used due to unequal variance between groups as determined by F-test.

