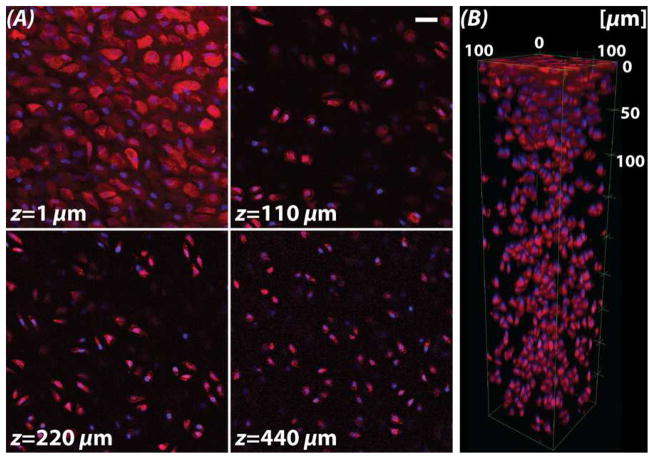
Figure 3. Visualization of fluorescent markers observed through the cartilage depth are limited by the working distance of the microscope objective.
(A) Fluorescent labeling of cell membranes (DiI, red) and nuclei (Hoechst, blue) enabled the visualization by standard confocal microscopy of chondrocytes deep into the middle zone (MZ), limited by the working distance of the objective. Superficial zone chondrocyte morphologies were visualized as flat and spread (at 1 μm), whereas MZ cells maintained a more typical rounded phenotype. (B) Three-dimensional rendering of chondrocytes show variations in cell patterning from the articular surface (top) to deep tissue regions. Scale bar = 20 μm.

