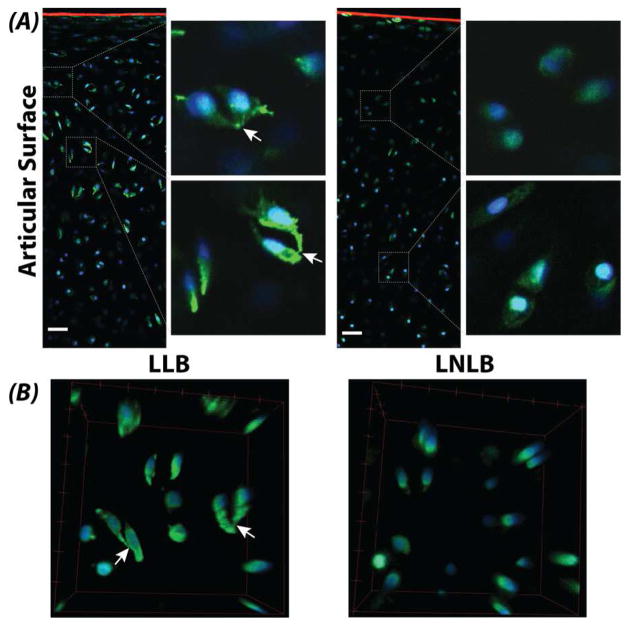
Figure 6. Cellular connectivity was observed in the load-bearing regions of articular cartilage following optical clearing.
(A) Chondrocytes in the load-bearing regions of lateral condyles showed connectivity and protrusions (white arrows) compared to non-load-bearing regions. Cartilage was stained for SZP/lubricin/PRG4 (red), actin (green), and DNA (blue). Scale bars = 20 μm. (B) Three-dimensional renderings of chondrocytes confirm cell connectivity. Bounding box dimensions = 40×40×20 μm3 (l×w×h).

