
Figure 7.
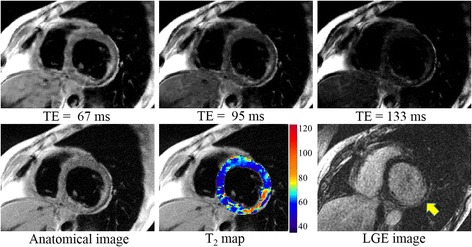
Images of a patient with myocardial infarct scar. (Top) Three out of the 16 TE images reconstructed from undersampled data sets (16 radial views per TE) using CURLIE. (Bottom) The anatomical image, reconstructed by filtered back-projection using the full k-space data set (all 256 radial views), is shown on the lower left panel. The colorized T2 map of the left ventricle overlaid onto the anatomical image is displayed in the lower middle panel for CURLIE-SEPG. The LGE image is shown in the lower right panel.