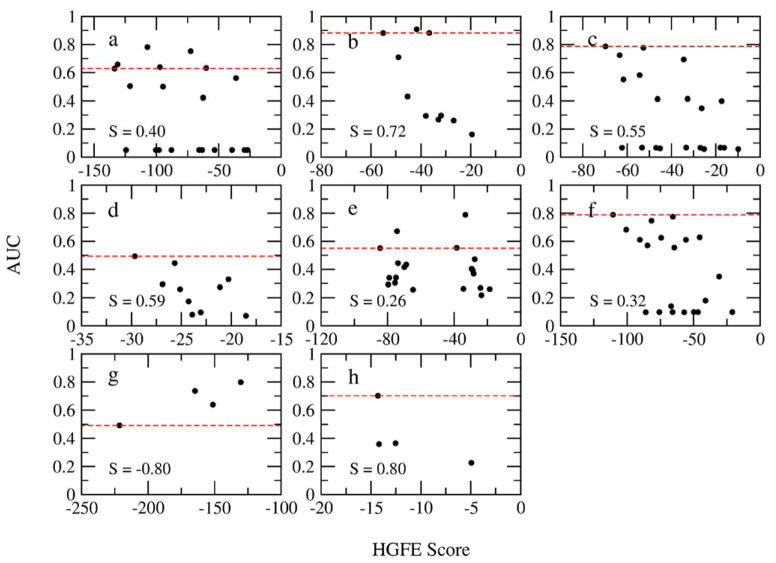
Figure 4.
Relationship between HGFEs of all possible pharmcophore models containing three features and AUCs from VS for each target. (a) HIVPR; (b) FXa; (c) DHFR; (d) FGFr1; (e) P38 MAP; (f) ADA; (g) ER; (h) AmpC. The Spearman correlation coefficients S are shown. The red dashed line represents the AUC value for the model with the most favorable HGFE for each target.

