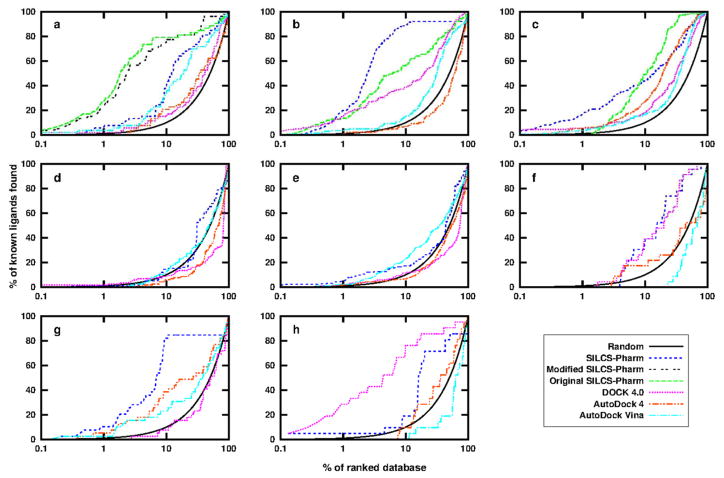
Figure 5.
Enrichment plots of the SILCS pharmacophore modeling using DUD data sets for the eight protein targets: (a) HIVPR; (b) FXa; (c) DHFR; (d) FGFr1; (e) P38 MAP; (f) ADA; (g) ER; (h) AmpC. Results using DOCK 4.0, AutoDock 4 and AutoDock Vina are also shown for comparison. For the first three targets, the results from our former SILCS-Pharm study are shown. The black line indicates random selection of compounds from the database. The X axis is in logarithmic scale to show the early stage performance more clearly.

