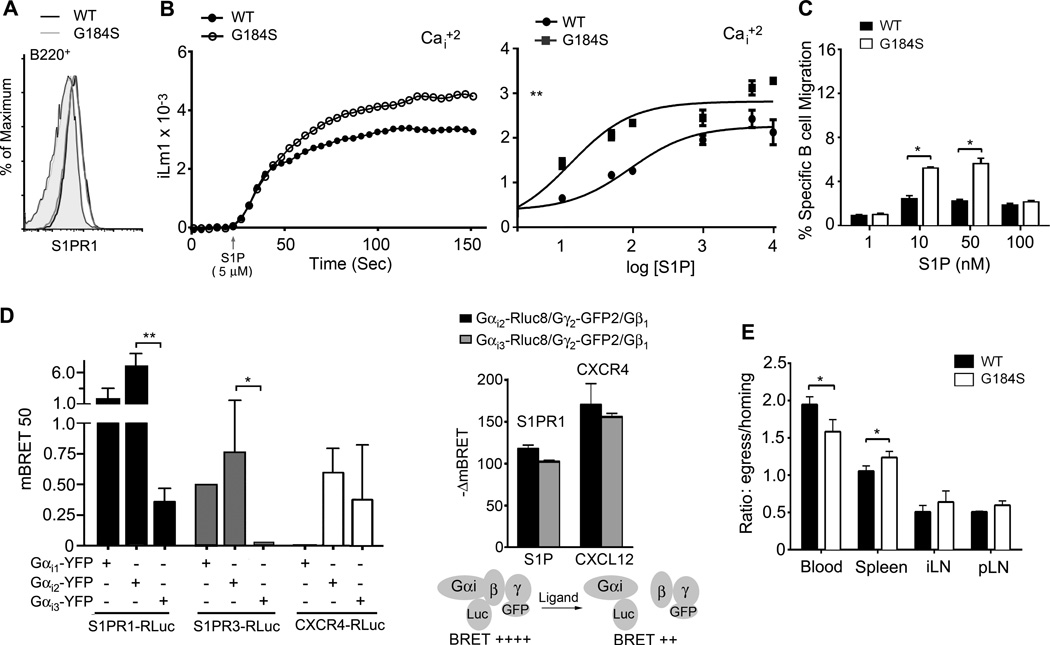
Figure 4.
G184S KI B cells have augmented S1P receptor signaling and no obvious impairment in LN egress. (A) Flow cytometry of B220+ B cells from WT and G184S KI mice to examine S1PR1 expression levels. Left two profiles (overlapping) are the background controls and the right two profiles (overlapping) are the S1PR1 antibody reactivity. (B) Intracellular calcium response to S1P using either wild type or G184S KI B cells. A representative calcium response to S1P stimulation is shown in left panel. In the right panel the peak intracellular calcium levels were plotted as a function of the log concentration of the S1P concentration used. Results from 2 wild type and 2 G184S KI reconstituted mice performed in duplicate. Data shown as mean +/− standard error of the mean. A non-linear regression curve fit generated using Prism software. (C) Cell migration in chemotaxis assays used to evaluate the responses of splenic B cells S1P. B cells from the 1:1 mixed chimera mice were used and wild type and G184S KI B cells were distinguished on the basis of CD45.1 versus CD45.2 expression. Data shown as the % cells migrated. Statistical differences calculated by 2- way ANOVA. (D) BRET assay to analyze the affinity of S1PR1, S1PR3, and CXCR4 for Gαi proteins and Gαi activation. HeLa cells expressing a BRET donor (S1PR1-RLuc, S1PR3-RLuc, or CXCR4-RLuc) and increasing amounts of the construct coding for BRET acceptor (Gαi1 -YFP, Gαi2 -YFP, or Gαi3 -YFP). The BRET ratios were calculated and the change in BRET determined (left panel). HeLa cells expressing either S1PR1 or CXCR4 along with the indicated plasmids were stimulated with S1P (200 nM) or CXCL12 (200 ng/ml) and changes in mBRET were measured. (E) Comparison of wild type and G184S KI B cell egress. B cells were prepared from 2 wild type, and from 2 G184S KI bone marrow reconstituted mice. The B cells were differentially labelled, mixed 1:1, and injected intravenously into 8 wild type mice. At 2 hours after injection 4 mice were sacrificed and 4 mice received CD62L. The later mice were sacrificed 18 hours later. The numbers of transferred cells in the spleen, inguinal LN, popliteal LN, and the blood was determined by flow cytometry. The data shown is the ratio between the cells at 18 hours and 2 hours at the different sites. Experiment repeated twice with similar results.

