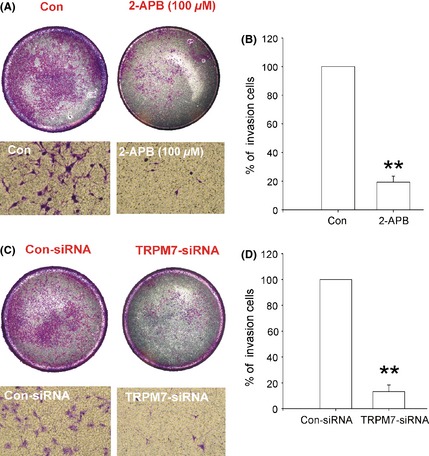
Figure 6.

Effect of 2‐APB and TRPM7 silencing on A172 cell invasion. (A) Representative images of the cell invasion. The upper images showing the whole wells. (B) Summary data showing the percentage of invaded cells (**P < 0.01, n = 4). (C) Representative imaging showing the invasion of A172 cells. The upper images showing the whole wells. (D) Summary data showing the percentage of invaded cells (**P < 0.01, n = 4). Data were collected from four independent experiments.
