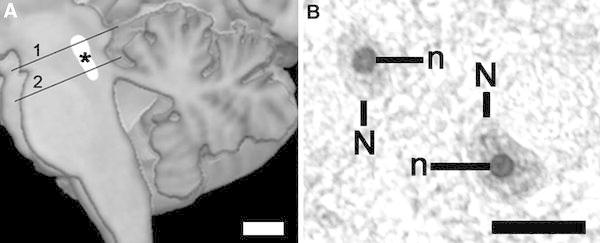
Fig. 1.

a Schematic picture of dorsal raphe nucleus localisation (*) with both levels (1, 2) where the investigations are carried out (scale bar 10 mm). b After AgNOR staining, the borders of AgNOR areas (representing nucleoli) (n) are clearly visible within nuclei (N) of DRN neurons (residual schizophrenia case, ventral subnucleus, scale bar 20 µm). The differences in AgNOR parameters are beyond qualitative evaluation and they could only be captured by means of quantitative measurements
