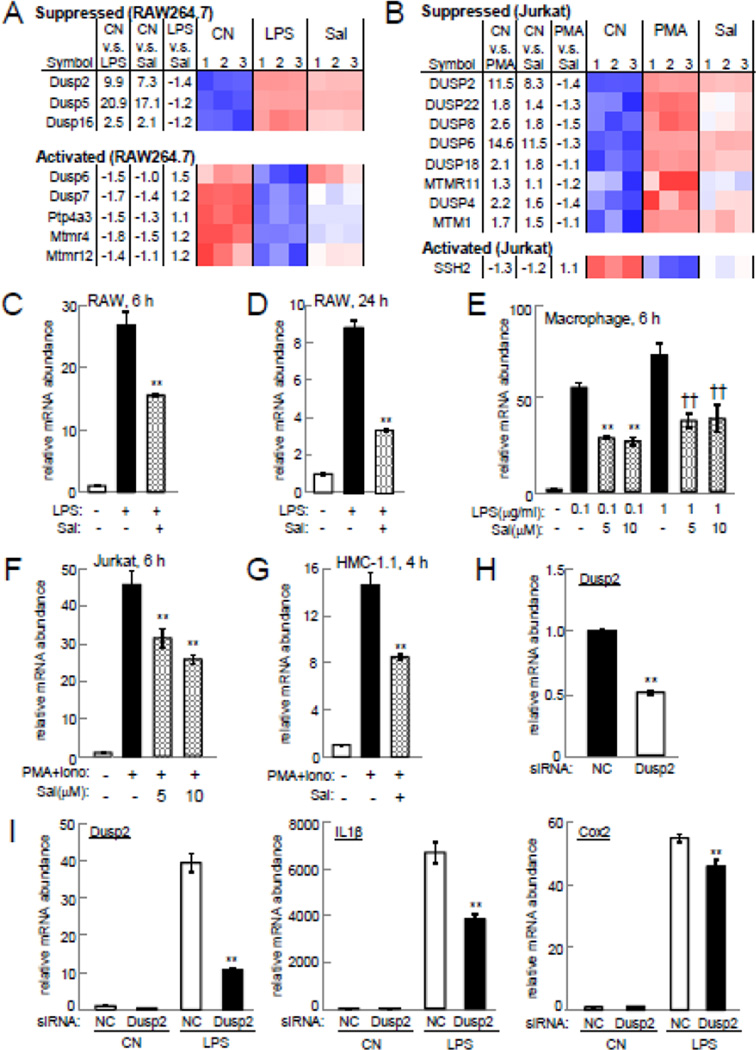
Figure 4.
Salubrinal-driven suppression of Dusp2 upregulation. Note that CN=control, and Sal=salubrinal in the presence of LPS (RAW264.7) or PMA/ionomycin (Jurkat). (A) Heatmap of DUSP genes in RAW264.7 cells. (B) Heatmap of DUSP genes in Jurkat cells. (C&D) Levels of Dusp2 mRNA in RAW264.7 cells at 6 h and 24 h, respectively. (E) Dusp2 mRNA level in primary macrophages at 6 h. (F) Dusp2 mRNA level in Jurkat cells at 6 h. (G) Dusp2 mRNA level in HMC-1.1 cells at 4 h. (H) Dusp2 mRNA level in RAW264.7 cells treated with Dusp2 siRNA. (I) Levels of Dusp2, IL1β, and Cox2 mRNAs in RAW264.7 cells treated with Dusp2 siRNA in the presence and absence of LPS at 6 h.

