Figure 1.
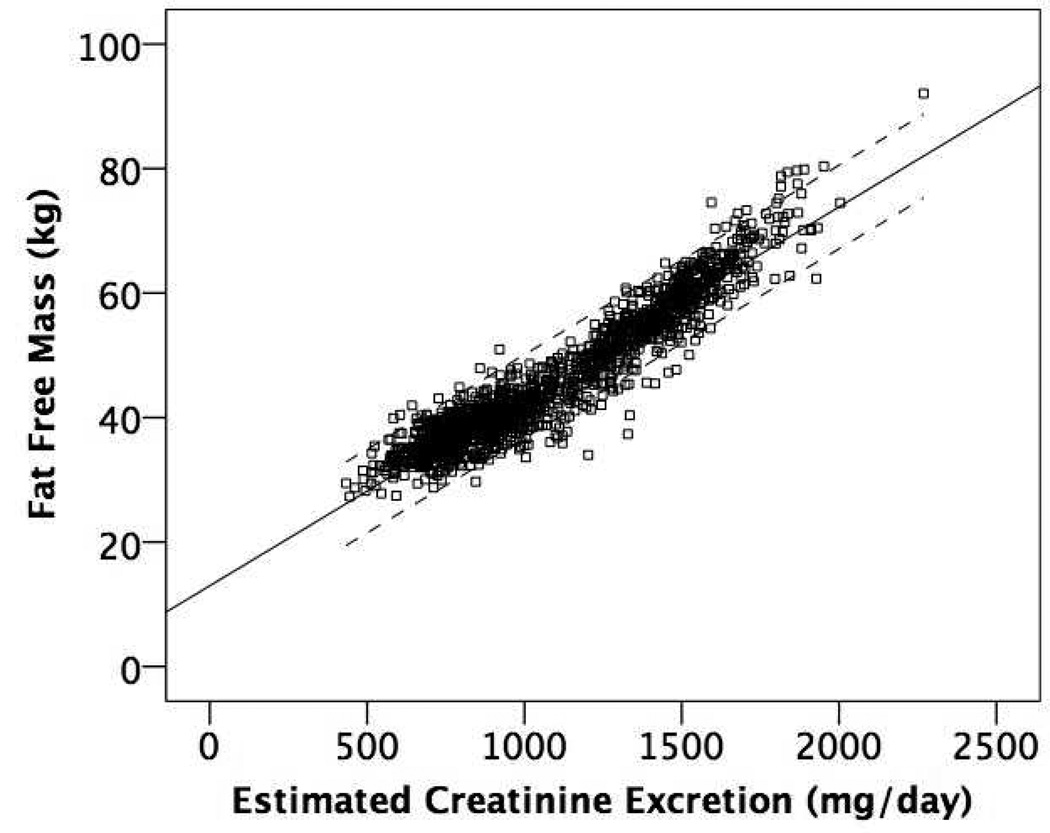
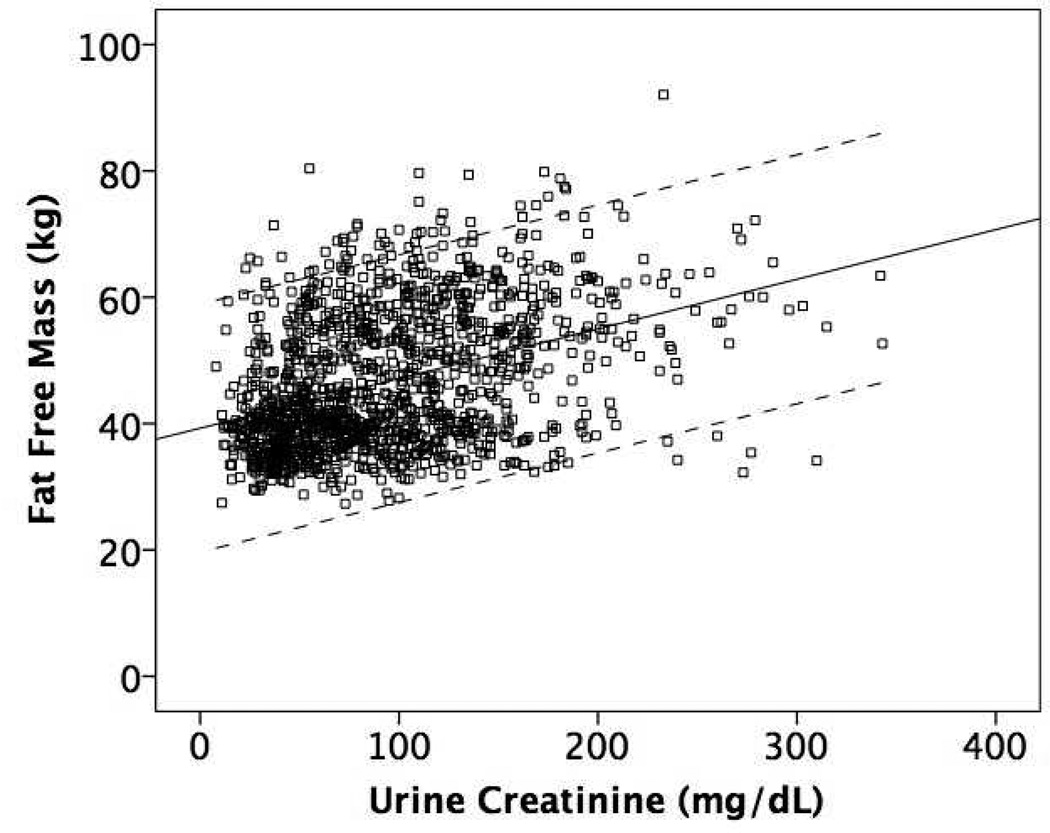
Mean regression lines and 95% limits of agreement for A) Estimated 24-hour creatinine excretion (eCER) and B) spot urine creatinine (UCr) with fat free mass (FFM) by dual x-ray absorptiometry (DXA) All (n=1371)
A) Regression equation: FFM (kg) = 13.0 + 0.03*eCER (mg/day)
B) Regression equation: FFM (kg) = 39.3 + 0.08* spot UCr (mg/dL)


