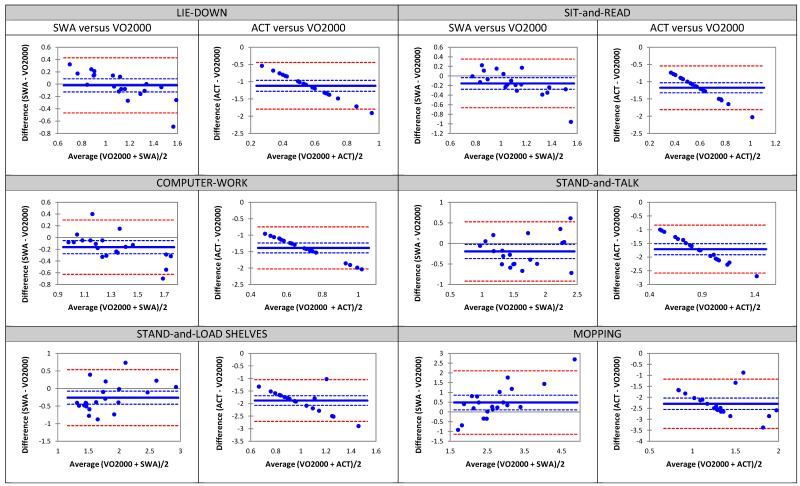
FIGURE 2.
Bland-Altman plots illustrating the differences between energy expenditure, expressed in kcal/min, estimated by the Actigraph (ACT)a, SenseWear Armband (SWA)b, and the criterion method (VO2000)c, across the 6 non-walking activities.
Blue solid line indicates difference between measures from portable device and VO2000. Blue dashed line indicates 95% confidence interval around the difference between devices. Red dashed line indicates the 95% limit of agreement between pooled mean from both devices.

