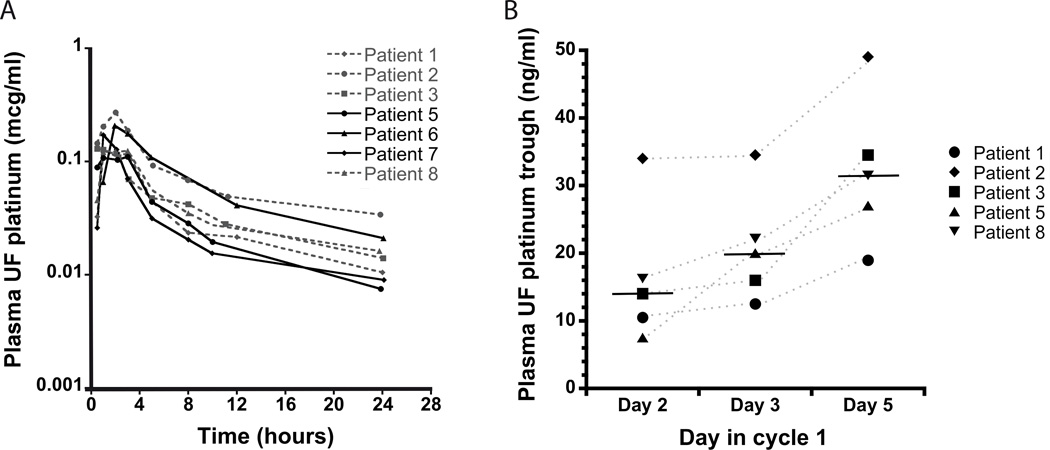
Figure 1.
Satraplatin pharmacokinetics. Day 1 Plasma UF platinum concentration × time curves in 7 patients. Patients enrolled at DL1 are depicted with dashed lines and patients enrolled at DL2 are depicted with bold lines (A). Plasma UF platinum trough concentrations on days 2, 3 and 5 in five patients (B).

