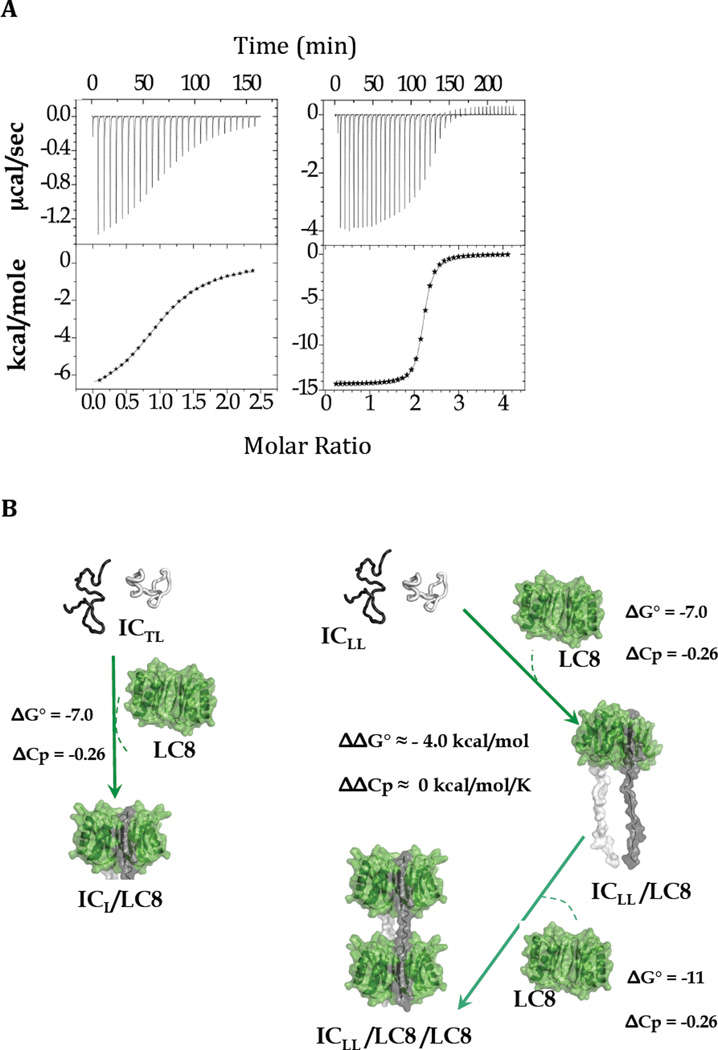
Figure 2.
Thermodynamics of LC8 binding to monovalent and bivalent IC. (A) Representative ITC thermograms (top panels) and binding isotherms (bottom panels) for titration of ICTL (left) and ICLL (right) with LC8. (B) Binding free energies ΔG° (kcal/mol), and ΔCp (kcal/mol/K) are given for each step. The difference in free energy and heat capacity changes between the second and first binding events of LC8 to ICLL (right) are expressed as ΔΔG° and ΔΔCp, respectively, and are shown in the center. Binding parameters for the first ICLL/LC8 binding event are assumed to be similar to those to ICL (left). Binding parameters for the second ICLL/LC8 binding event are inferred from average values determined from direct measurements. Figures adapted from [5].

