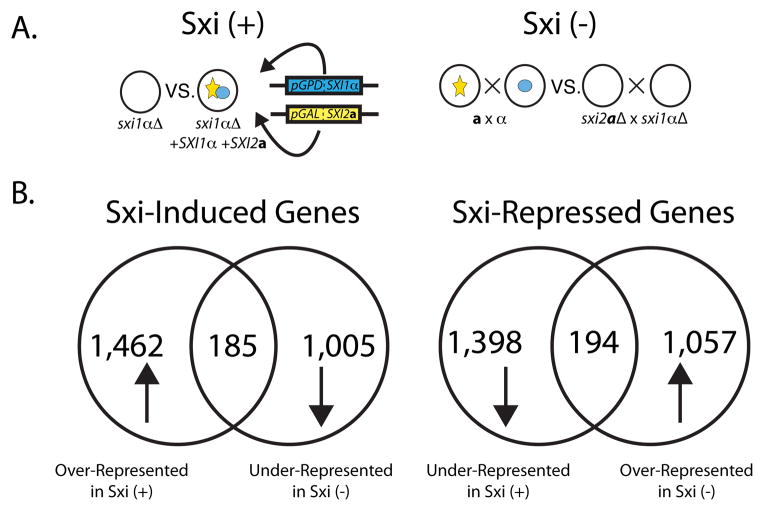
Figure 2. Sxi proteins regulate the transcript levels of over 350 genes.
A. Schematic representation of two independent Sxi regulation experiments. In the Sxi (+) experiment (left), SXI2a and SXI1α were expressed under the control of the GAL7 and GPD1 promoters, respectively, in a sxi1αΔ strain. Transcripts from this strain were compared with the sxi1αΔ strain expressing no Sxi proteins. In the Sxi (−) experiment (right), transcript abundance was compared between a wild type cross (a x α) and a cross between Sxi deletion strains (sxi2aΔ x sxi1αΔ). Sxi1α is represented in blue, and Sxi2a is in yellow. B. Classes of Sxi-regulated genes. Transcripts of Sxi-Induced genes were over-represented in the Sxi (+) experiment and under-represented in the Sxi (−) strain. Sxi-Repressed gene transcripts were under-represented in the Sxi (+) experiment and over-represented in the Sxi (−) experiment. Venn diagrams represent the total and the overlap in the number of genes from each experiment that displayed the indicated pattern of expression.

