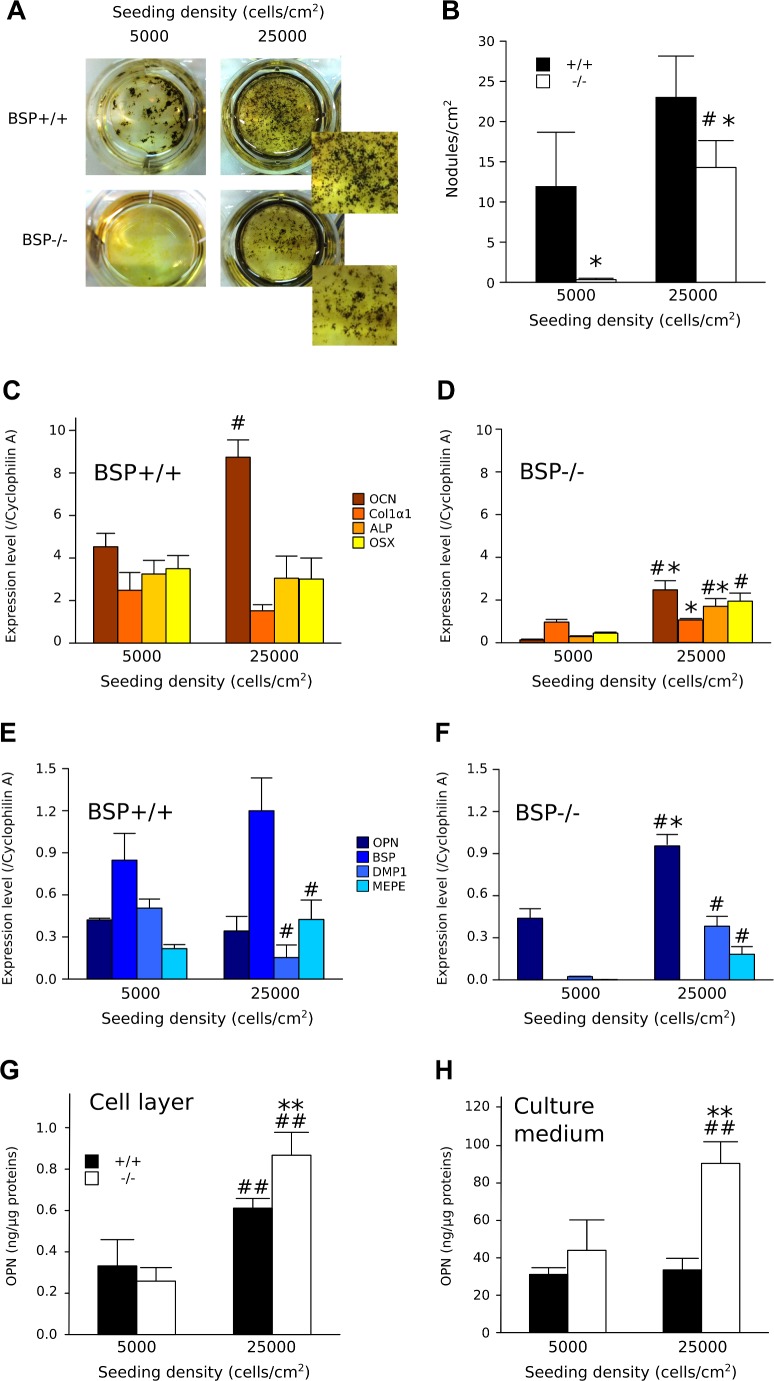
Fig 5. In vitro osteoblast differentiation in standard and high density BSP+/+ and BSP-/- MCC cultures.
(A) Micrographs (Insets: higher magnification) and (B) quantification of total mineralized colonies formed at D14 in BSP+/+ and BSP-/- MCC cultures grown at standard (5000 cells/cm2) and high density (25000 cells/cm2). N = 3 dishes/group. Expression of osteoblast-associated (C and D) and SIBLING genes (E and F) at D14 in BSP+/+ (C, E) and BSP-/- (D, F) cultures. N = 3 dishes/group. Quantification of OPN in the cell layer (G) and the culture medium (H) of BSP+/+ and BSP-/- standard and high density cultures. Results are normalized on total cell layer proteins. N = 6 dishes/group. *: p< 0.05, **: p<0.01 vs BSP+/+; #: p< 0.05, ##: p<0.01 vs standard density. Mann-Whitney U Test.

