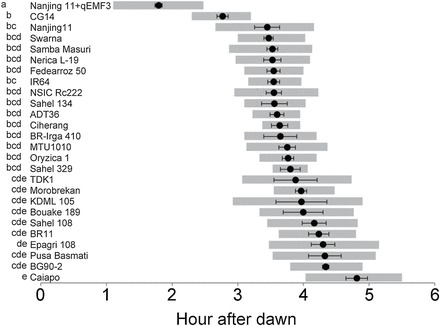
Fig. 6.

Comparison of time to 10% (T10), 50% (T50) and 90% (T90) after dawn in Nanjing 11+qEMF3 and popular rice cultivars grown in the tropics and subtropics. Grey bars indicate time from T10 to T90 for each cultivar. T10, T50, and T90 calculations are shown in Supplementary Figure S2. The same letters on the left side of the cultivar names indicate no significant difference in T50. The Tukey–Kramer test (P < 0.05) was used for multiple comparisons between groups.
