
Fig. 10.
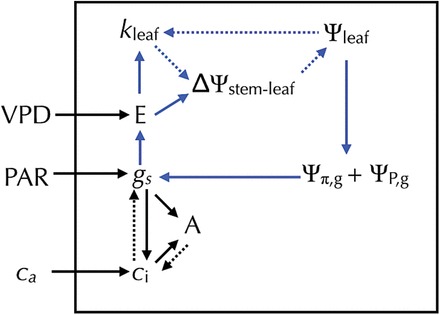
Model diagram showing the coordination between transpiration rate (E), the difference between stem and leaf water potential (ΔΨstem–leaf), leaf hydraulic conductance (k leaf), stomatal conductance (g s, where boundary layer conductance g b is sufficiently high for g s to dominate), and CO2 assimilation rate (A). The blue lines represent the hydraulic feedback loop between g s and E. Solid lines represent a positive relationship between parameters and dotted lines represent a negative relationship. The positive relationship between E and k leaf is the predicted relationship based on data gathered from H. annuus plants grown under low, medium, and high CO2 concentrations, and three gymnosperm and angiosperm tree species growing in a common garden (see Methods for more detail). The black box indicates the boundary between leaf processes and external environmental variables. (VPD, leaf-to-air vapour pressure difference; PAR, photosynthetically active radiation; C a, atmospheric CO2 concentration, C i, leaf internal CO2 concentration, Ψπ,g, is the guard cell osmotic pressure, and ΨP,g, guard cell turgor pressure).