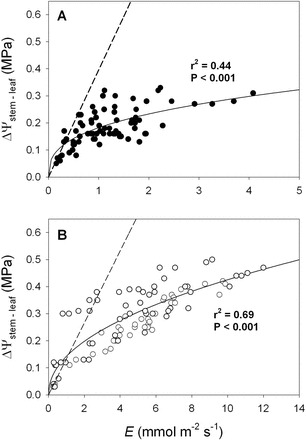
Fig. 4.

The difference between stem and leaf water potential (ΔΨstem–leaf, MPa) as a function of transpiration rate (E, mmol m–2 s–1) for: (A) gymnosperm and (B) angiosperm tree species from the common garden. Solid lines, as well as r 2 and P values are as for Fig. 2. The dashed lines represent the predicted changes in ΔΨstem–leaf for a leaf that possesses the average static leaf hydraulic conductance (i.e. k leaf(0)) for the (A) gymnosperm and (B) angiosperm species.
