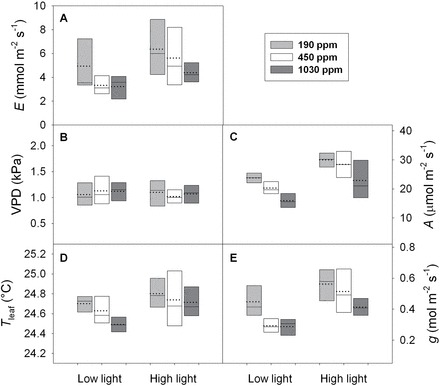
Fig. 7.

The range (indicted by boxes), median (horizontal line within boxes), and mean (dotted line within boxes) of: (A) transpiration rate (E, mmol m–2 s–1), (B) leaf-to-air vapour pressure difference (VPD, kPa), (C) CO2 assimilation rate (A, µmol m–2 s–1), (D) leaf temperature (T leaf, °C), and (E) leaf surface conductance, comprising the sum of stomatal and boundary layer conductances g s and g b (g, mol m–2 s–1) during measurements of leaf hydraulic conductance (k leaf) at both low (500 µmol m–2 s–1 PAR) and high light (1300 µmol m–2 s–1 PAR), for H. annus plants grown under ~190 (grey boxplot), 450 (open boxplot), and 1030 ppm CO2 (dark grey boxplot). Note that here, g b is considered sufficiently high such that g ≈g s.
