
Fig. 8.
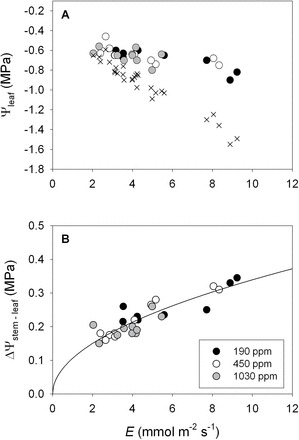
The influence of variation in transpiration rate (E, mmol m–2 s–1) on (A) leaf water potential and (B) the difference between stem and leaf water potential (ΔΨstem–leaf, MPa) for: H. annus plants grown under ~190 (filled circles), 450 (open circles), and 1030 ppm CO2 (grey circles). The crosses in A represent the predicted leaf water potentials for a leaf that possesses the average static leaf hydraulic conductance (i.e. k leaf(0)=9.08 mmol m–2 s–1 MPa–1) across all three CO2 treatments. The solid black line in panel (B) represents the best-fit model describing the coordination between ΔΨstem–leaf and E.