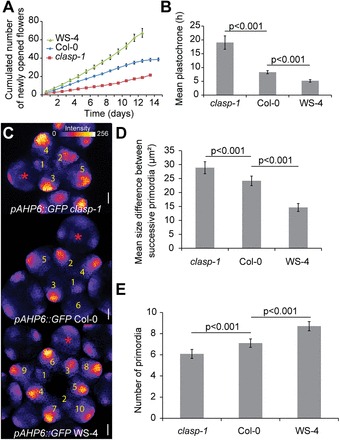
Fig. 3.

Plastochrone in clasp-1, Col-0, and WS-4. (A) Cumulated number of newly opened flowers in clasp-1 (n=16), Col-0 (n=24), and WS-4 (n=17). (B) Mean plastochrone calculated from the first 10 d of flower production (two-tailed Student test). (C) Representative clasp-1, Col-0, and WS-4 meristems expressing the pAHP6::GFP marker of organ identity, using the ImageJ Fire lookup table. Scale bars=20 μm. (D) Mean size difference between successive primordia in clasp-1, 147 organs, 26 meristems; Col-0, 148 organs, 23 meristems; WS-4, 161 organs, 20 meristems, two-tailed Student tests. (E) Quantification of the number of GFP-positive stage 1 and stage 2 primordia in clasp-1 (n=12 meristems), Col-0 (n=20 meristems), and WS-4 (n=17 meristems), two-tailed Student tests.
