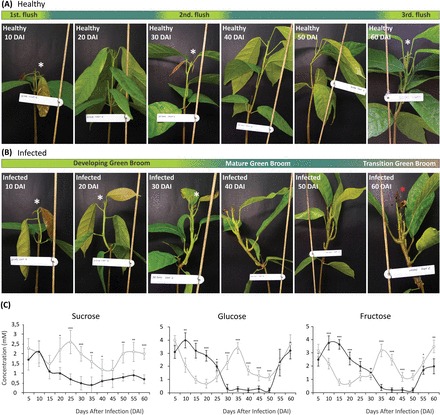
Fig. 1.

Development of WBD in cacao seedlings during the first 60 days after infection (DAI) of the time course experiment for assessing apoplastic fluid carbohydrate dynamics. (A) Representative pictures comparing the developmental stages of healthy plants (upper panel) and (B) infected plants (lower panel), highlighting the differences in the periods of apical meristem activity (white asterisks) and the first appearance of necrosis in infected plants (black asterisk). (C) Millimolar concentrations of sucrose, glucose, and fructose in the apoplastic fluid of healthy (open circles) and infected seedlings (filled circles). Data points represent the mean of four biological replicates with calculated standard deviations (unpaired Student’s t-test; *P<0.05; **P<0.005; ***P<0.0005). (This figure is available in colour at JXB online.)
