Fig. 4.

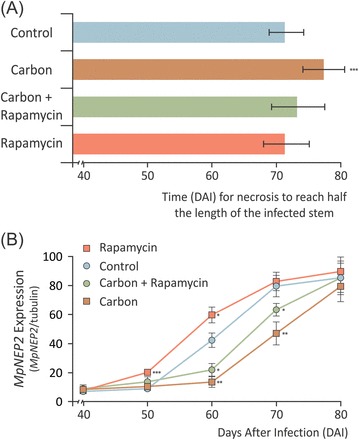
Manipulation of apoplastic fluid carbon availability alters MpNEP2 expression and the necrosis rate of infected tissues. (A) Time (in days ater infection) that necrotic symptoms took to cover 50% of the length of infected stems after infiltrations with solutions containing carbon (sucrose, glucose, and fructose at 10mM each), carbon with 400ng ml–1 rapamycin, and rapamycin only. (B) MpNEP2 gene expression assayed at 10 d intervals after infiltration of infected stems. Data points represent the mean of four biological replicates with calculated standard deviations (unpaired Student’s t-test; *P<0.05; **P<0.005; ***P<0.0005). (This figure is available in colour at JXB online.)
