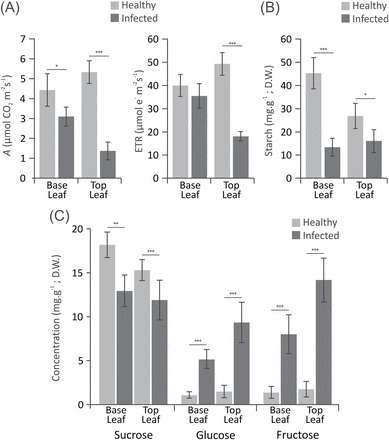
Fig. 6.

A spatial pattern of photosynthesis down-regulation and soluble sugar accumulation in leaves of mature green brooms. (A) Mean photosynthesis (A) and electron transport rate (ETR) levels in the first (older, at the base) and last (younger, at the top) fully expanded leaves of mature green brooms (30 DAI). (B) Mean levels of starch, and (C) sucrose, glucose, and fructose measured in the same leaves assayed for photosynthesis. Data points represent the mean value of eight biological replicates with calculated standard deviation (unpaired Student’s t-test; *P<0.05; **P<0.005; ***P<0.0005).
