
Fig. 8.
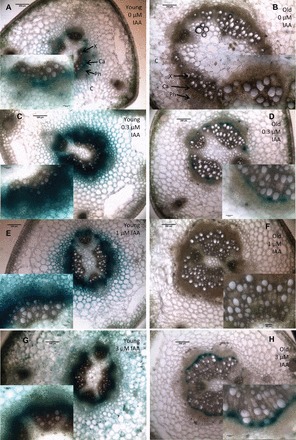
DR5:GUS expression in the bases of young (A, C, E, G) or old (B, D, F, H) cuttings treated with 0 µM (A, B), 0.3 µM IAA (C, D), 1 µM IAA (E, F), or 3 µM IAA (G, H) and all stained at 24h after cutting. C, cortex; Ph, phloem; Ca, cambium; X, xylem. Samples were cleared for 45min in acetone on ice, stained in x-gluc for 24h, free hand sections made and photographed mounted in water. Subset panels from same images at higher cellular resolution. Sections were cut from four separate stems for each age/treatment combination. Inset images are of the vascular bundles (containing xylem, cambium, and phloem). Bars in full size panels are 200 µm, bars in the inset panels are 60 µm.