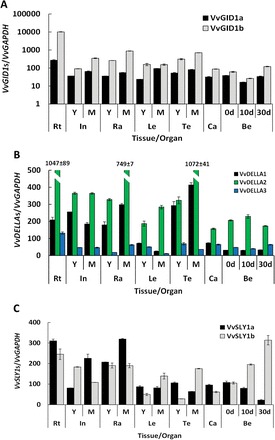
Fig. 6.

Spatial and temporal expression profiles in V. vinifera cv. Thompson seedless of VvGID1a and VvGID1b (A); VvDELLA1, VvDELLA2, and VvDELLA3 (B); and VvSLY1a and VvSLY1b (C). Total RNA was extracted from pooled samples, and the absolute mRNA levels of each gene were determined by qRT-PCR and normalized against VvGAPDH. To ensure accurate quantitation of transcript levels, primers of similar efficiencies were used, and calibration curves determined from known copy numbers of single plasmids containing all qRT-PCR amplicons. The bars represent the mean ± SE of three biological repeats with two technical repeats each. In, internodes; Ra, rachis; Le, leaves; Te, tendrils; Ca, carpels; Be, berries; 0 d, berries sampled at 2–3mm diameter (E-L 27); 10 d, berries sampled 10 day after E-L 27; 30 d, berries sampled 30 days after E-L 27; Y, young; M, mature. The y-axis (expression) of panel (A) is presented with log values. This figure is available in colour at JXB online.
