
Fig. 1.
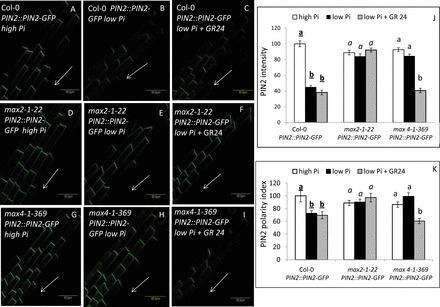
PIN2 PM localization and polarity in the epidermal cells of the primary-root elongation zone in PIN2::PIN2–GFP seedlings grown under high (2mM) and low (1 µM) Pi conditions (48 HPG) and the effect of GR24 treatment. (A–I) PIN2–GFP signal in Col-0 (A–C), max2-1 (max2-1–22; D–F), and max4-1 (max4-1–369; G–I) in roots grown on high-Pi plates (A, D, G), low-Pi plates (B, E, H), and low-Pi plates supplemented with GR24 (C, F, I). Arrows indicate root-wise (downwards). Bars, 50 µm. (J) Intensity of PIN2–GFP signal in the apical plasma membrane of Col-0, max2-1–22, and max4-1–369 roots grown on high-Pi plates (white columns), low-Pi plates (black columns), and low-Pi plates supplemented with GR24 (grey columns). (K) Polarity of the PIN2–GFP signal in the plasma membrane of Col-0, max2-1–22, nd max4-1–369 roots grown on high-Pi plates (white columns), low-Pi plates (black columns), and low-Pi plates supplemented with GR24 (grey columns). Polarity index was determined as the ratio of intensity on the polar versus lateral sides, divided by 2 (Pandya-Kumar et al. 2014). Cells (n=50–60) from 10 plants were examined for each of three replicates. Different lower-case letters above the bars indicate statistically significant differences between means by a multiple-comparison Tukey–Kramer test (P≤0.05).